The plan is to review the Stanford Machine Learning course and to complete the homework projects using python instead of Matlab.
Data source: Stanford Machine Learning course.
Linear regression with one variable
The 1st column is the population of a city and the second column is the profit of a food truck in that city. A negative value for profit indicates a loss.
Importing libraries
1
2
3
4
5
import pandas as pd
import seaborn as sns
import matplotlib.pylot as plt
from sklearn.metrics import r2_score
from sklearn.linear_model import LinearRegression
Acquiring data
1
2
3
data=pd.read_csv('ex1data1.txt',header=None)
x_train = data[0].reshape(-1, 1)
y_train = data[1].reshape(-1, 1)
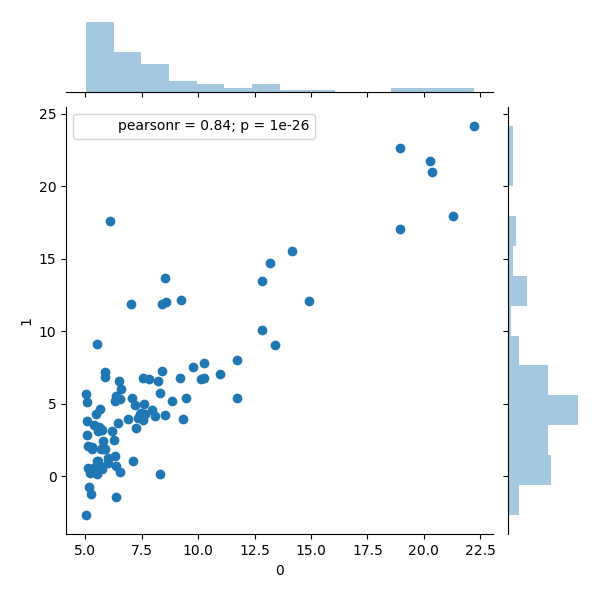
Plotting the data
Before starting on any task, we use scatter plot to visualize data to better understand it.
1
sns.jointplot(x=0,y=1,data=data)
Modeling and predicting
Normally we should split the sample into training set and test set. For this simple problem, we’ll just train out model with entire dataset and see how our model fit. This time we use matplotlib for data visualizing.
1
2
3
4
5
6
7
linereg = LinearRegression()
linereg.fit(x_train, y_train)
y_predict = linereg.predict(x_train)
plt.scatter(x_train, y_train, color='blue')
plt.plot(x_train,y_predict,color='red')
plt.show()
print('Variance score: %.2f' % r2_score(y_train, y_predict))
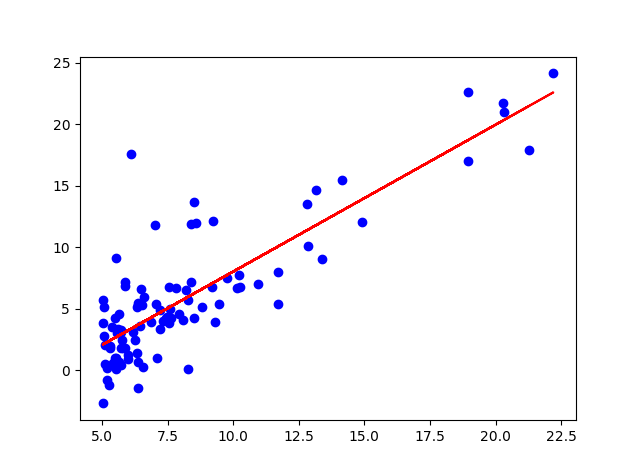
Variance score: 0.70
Linear regression with multiple variable
This time the task is to predict housing prices based on the size of the houses and the number of bedrooms. Similar process as above.
1
2
3
4
5
6
7
data2 = pd.read_csv('F:\Projects\PythonProjects\StanfordML\ex1\ex1data2.txt',header=None)
x_train2 = data2[[0,1]]
y_train2 = data2[2].reshape(-1, 1)
linereg2 = LinearRegression()
linereg2.fit(x_train2, y_train2)
y_predict2 = linereg2.predict(x_train2)
print('Variance score: %.2f' % r2_score(y_train2, y_predict2))
Variance score: 0.73